Add Custom Prometheus Metrics in Kie Server
Following up this post where we extend an existing capability of a Kie Server image. We’re going to provide custom Prometheus metrics in Kie Server now.
We’re going to continue with the same example that says hello to people. For this purpose, we are going to create a custom metric to count the number of matched rules. So using this counter, we can know the number of people that we said hello.
1.- Create Project
mvn archetype:generate -DgroupId=org.sgitario.jbpm -DartifactId=extend-metrics -DarchetypeArtifactId=maven-archetype-quickstart -DinteractiveMode=false
2.- Add kie server dependencies into the pom.xml
Depending on the Kie Server image, you might need to change the kie server dependencies. For Kie Server 7.7.1 image, the dependencies version is 7.38.0.Final.
<dependency>
  <groupId>org.kie.server</groupId>
  <artifactId>kie-server-services-prometheus</artifactId>
  <version>${version.org.kie}</version>
</dependency>
3.- Extend capatibility to trigger Drools rules via REST endpoint
This capatibility was added as part of this post. So, add the sources, resources and dependencies following the instructions in the post.
4.- Implement AgendaEventListener interface that listen for the matched rules
In our example, we say hello using a drools rule, therefore we need to implement the interface AgendaEventListener.
| In case we use a decision table (dmn), we should implement the interface DMNRuntimeEventListener and provide the implementation in the createDMNRuntimeEventListener method (see step 4) |
package org.sgitario.jbpm;

// imports

import io.prometheus.client.Counter;

public class RulesMatchedCountAgendaEventListener implements AgendaEventListener {

	protected static final Counter counter = Counter.build().name("rules_matched_count").help("Count of matched rules.")
			.labelNames("rule_name").register();

	@Override
	public void afterMatchFired(AfterMatchFiredEvent event) {
		counter.labels(event.getMatch().getRule().getName()).inc();
	}

	// rest of methods (leave them as unimplemented)

}
We have created a counter to have a count of the number of triggered and matched rules. This counter can be grouped by the rule name which can be useful when generating the graphs in Prometheus (to check the counter by rule name).
5.- Implement PrometheusMetricsProvider interface in order to provide our custom metrics
public class RulesPrometheusMetricsProvider implements PrometheusMetricsProvider {

	@Override
	public AgendaEventListener createAgendaEventListener(String kieSessionId, KieContainerInstance kContainer) {
		return new RulesMatchedCountAgendaEventListener();
	}

	// rest of methods should return null.

}
6.- Make the implementation of PrometheusMetricsProvider discoverable
To make the new endpoint discoverable, create a src/main/resources/META-INF/services/org.kie.server.services.prometheus.PrometheusMetricsProvider file and add the fully qualified class name of the RulesPrometheusMetricsProvider implementation class within the file:
org.sgitario.jbpm.RulesPrometheusMetricsProvider
7.- Build the project
mvn clean package
It will generate the file target/extend-metrics-1.0-SNAPSHOT.jar.
8.- Create our own image of Kie Server
Create a file called Dockerfile:
FROM registry.redhat.io/rhdm-7/rhdm-kieserver-rhel8:7.7.1
COPY target/extend-metrics-1.0-SNAPSHOT.jar /opt/eap/standalone/deployments/ROOT.war/WEB-INF/lib/
| Note that we need to sign up in the Red Hat registry. |
Then, build the image:
docker build . --tag quay.io/jcarvaja/rhdm-kieserver-rhel8-custom-metrics
9.- Prepare the KJAR example
We’re going to create a pretty simple example in Drools (more about this topic in this post). This example will only say hello to persons.
First, we need a Maven repository to be accessible to push the KJar module and our Kie Server:
docker run -d -p 8081:8081 --name nexus sonatype/nexus
The default credentials is admin/admin123.
Create the pom.xml:
<?xml version="1.0" encoding="UTF-8"?>
<project xsi:schemaLocation="http://maven.apache.org/POM/4.0.0 http://maven.apache.org/xsd/maven-4.0.0.xsd" xmlns="http://maven.apache.org/POM/4.0.0"
    xmlns:xsi="http://www.w3.org/2001/XMLSchema-instance">
  <modelVersion>4.0.0</modelVersion>
  <groupId>org.jbpm.test</groupId>
  <artifactId>say-hello-kjar-example</artifactId>
  <version>1.0-SNAPSHOT</version>
  <packaging>kjar</packaging>
  <name>say-hello-kjar-example</name>

  <build>
    <plugins>
      <plugin>
        <groupId>org.kie</groupId>
        <artifactId>kie-maven-plugin</artifactId>
        <version>7.38.0.Final</version>
        <extensions>true</extensions>
      </plugin>
    </plugins>
  </build>

  <distributionManagement>
   <snapshotRepository>
      <id>nexus-snapshots</id>
      <url>http://localhost:8081/nexus/content/repositories/snapshots</url>
   </snapshotRepository>
</distributionManagement>
</project>
Then, the *Person.java domain model:
package org.jbpm.test;

public class Person  implements java.io.Serializable {

    private Integer age;
    private String name;

    // constructors, getters and setters
}
The say-hello-person.drl rule:
import org.jbpm.test.Person;

rule SayHello
  when
	  $p : Person(age >= 21)
  then
	  System.out.println("Hello " + $p.getName());
end
And finally, we build and publish the artifact into our Nexus instance:
mvn --settings settings.xml clean install deploy
10.- Test it
We first need to run our Kie Server image. The key point here is to enable the prometheus integration using the PROMETHEUS_SERVER_EXT_DISABLED parameter:
docker run -it -p 8080:8080 -p 9123:9123 --rm --env KIE_ADMIN_USER=admin --env KIE_ADMIN_PWD=admin --env MAVEN_MIRROR_URL=http://nexus:8081/nexus/content/groups/public/ --env PROMETHEUS_SERVER_EXT_DISABLED=false --link nexus --name kieserver quay.io/jcarvaja/rhdm-kieserver-rhel8-custom-metrics
Then, we need to deploy the prometheus instance:
docker run -it -p 9090:9090 -v ${PWD}/prometheus-config.yml:/etc/prometheus/prometheus.yml:z --link kieserver --name prometheus prom/prometheus:v2.8.0 --config.file=/etc/prometheus/prometheus.yml
Where prometheus-config.yml is:
scrape_configs:
  - job_name: 'kie-server'

    scrape_interval: 10s

    metrics_path: /services/rest/metrics

    basic_auth:
      username: 'admin'
      password: 'admin'

    static_configs:
      - targets: ['kieserver:8080']
Prometheus will collect the metrics by calling kieserver:8080/services/rest/metrics every 10s.
Now, we’re going to run the same KJAR example as in this post (step 9):
curl -X PUT "http://admin:admin@localhost:8080/services/rest/server/containers/sayHello" -H "accept: application/json" -H "Content-Type: application/json" -d "{ \"container-id\" : \"sayHello\", \"release-id\" : { \"group-id\" : \"org.jbpm.test\", \"artifact-id\" : \"say-hello-kjar-example\", \"version\" : \"1.0-SNAPSHOT\" }}"
And run our example:
curl -X POST "http://admin:admin@localhost:8080/services/rest/server/containers/instances/sayHello/customksession/ksession" -H "Content-Type: application/json" -d '[{"org.jbpm.test.Person": {"name": "john","age": 25}}]'
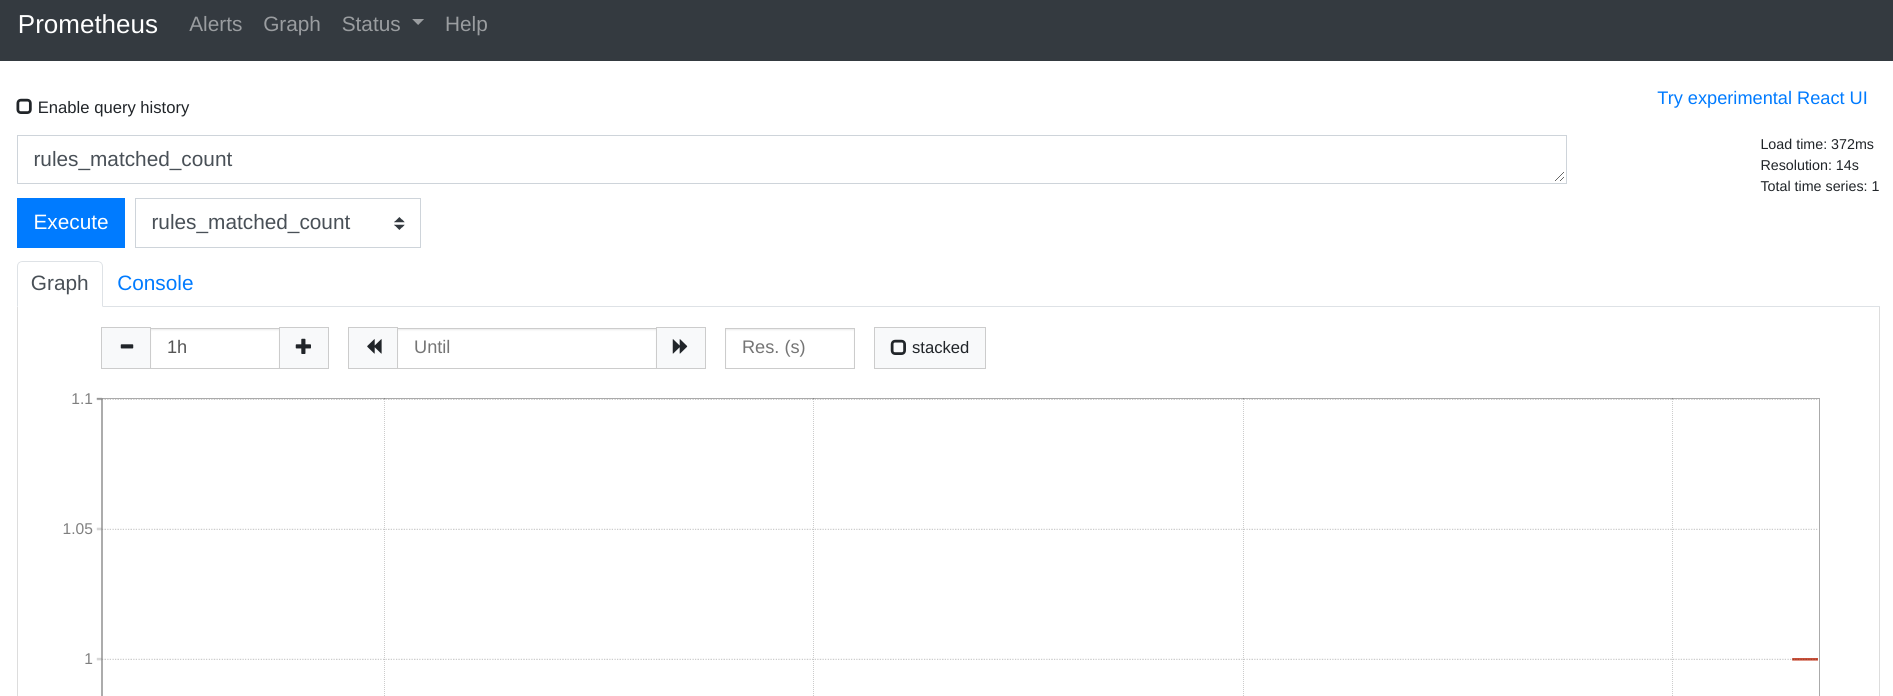
As the user “john” is older than 21, we expect our rule to be triggered. If we go to prometheus site, after several minutes, we should see our custom metric now:
Conclusion
Credits to this post where explains how to use the PrometheusMetricsProvider class to add custom metrics in a custom Kie Service (not overriding a Kie Server image) and the official support documentation where explains how to enable prometheus using a Kie Server image.
All the source code can be found in this repository.