
Monitoring Quarkus apps with Prometheus into OpenShift
We can enable monitoring in our Quarkus applications by using the Micrometer extension. Micrometer acts like a facade between our application and third parties that consumes the metrics such as Prometheus.
We can expose many different type of metrics either embedded ones (automatically enabled and populated if we use some Quarkus extensions or not) or custom metrics registered as part of our application. All this configuration is well documented in the Quarkus Micrometer guide.
Therefore, the scope of this post is about how to use the embedded Prometheus in OpenShift to expose the metrics from our Quarkus applications. Basically, we need to accomplish the next steps:
- Enable Monitoring for user-defined projects in OpenShift
- Deploy our Quarkus application
- Create a Service monitor in our project
Requirements
- Openshift CLI
- An Openshift instance
1. Enable Monitoring for user-defined projects in OpenShift
Basically, we need to follow the instructions from OpenShift documentation.
To sum up, we need to create a ConfigMap in the namespace openshift-monitoring.
cluster-monitoring-config.yaml:
apiVersion: v1
kind: ConfigMap
metadata:
    name: cluster-monitoring-config
    namespace: openshift-monitoring
data:
    config.yaml: |
    enableUserWorkload: true
And apply it:
oc apply -f cluster-monitoring-config.yaml
Note that this only works if you are using a 4.6+ version of OpenShift. For previous versions, use:
apiVersion: v1
kind: ConfigMap
metadata:
    name: cluster-monitoring-config
    namespace: openshift-monitoring
data:
    config.yaml: |
    techPreviewUserWorkload:
        enabled: true
What OpenShift will do next is to automatically create this namespace openshift-user-workload-monitoring where will deploy the necessary resources as part of the following steps.
2. Deploy our Quarkus application
Right now, we have the required infrastructure ready, let’s continue with the Quarkus application. We’ll implement a REST API and enable micrometer with prometheus, this is translated into having the next two Quarkus extensions into our pom.xml:
<dependency>
    <groupId>io.quarkus</groupId>
    <artifactId>quarkus-resteasy</artifactId>
</dependency>
<dependency>
    <groupId>io.quarkus</groupId>
    <artifactId>quarkus-micrometer-registry-prometheus</artifactId>
</dependency>
And we’ll add the next resource:
import javax.inject.Inject;
import javax.ws.rs.GET;
import javax.ws.rs.Path;

import io.micrometer.core.instrument.MeterRegistry;

@Path("/hello")
public class GreetingsResource {

    @Inject
    MeterRegistry registry;

    @GET
    public String sayHello() {
        registry.counter("greeting_counter").increment();

        return "Hello!";
    }
}
As we can see, we use the micrometer registry facade to create a counter that will be incremented every time this service is invoked.
Having this registry is super useful when we want to create custom metrics or manually use the metrics. But also we could annotate methods as follows:
@GET
@Counted(value = "greeting_counter")
public String sayHello() {
    return "Hello!";
}
Let’s try this application by running it:
mvn compile quarkus:dev
Now, we should be able to call our service:
curl http://localhost:8080/hello
And it should return Hello!. So good so far, but what about the metrics? Let’s browse to http://localhost:8080/q/metrics where should see our greeting_counter with count 1.0 (the one that we have just done):
# HELP greeting_counter_total
# TYPE greeting_counter_total counter
greeting_counter_total 1.0
Next, we need to deploy our Quarkus application into OpenShift. For ease this step, Quarkus provides a super useful extension called quarkus-openshift, let’s add it into our pom.xml:
<dependency>
    <groupId>io.quarkus</groupId>
    <artifactId>quarkus-openshift</artifactId>
</dependency>
Finally, let’s deploy our application into a newly created project my-project in OpenShift:
oc new-project my-project
mvn clean package -Dquarkus.kubernetes.deploy=true -Dquarkus.openshift.expose=true -Dquarkus.openshift.labels.app-with-metrics=quarkus-app
We’ll explain why is needed the label app-with-metrics for.
Note that if you are using an OpenShift with unsecure SSL, you also need to append -Dquarkus.kubernetes-client.trust-certs=true to the Maven command. |
3. Create a Service monitor in our project
Before moving forward, let’s explain first how Prometheus works. Prometheus uses a pull model to get metrics from apps. This means that Prometheus will scrape or watch endpoints to pull metrics from.
From the previous step, our service is now exposed in our OpenShift instance. But we didn’t configure anything in Prometheus to scrape our service yet. Well, exactly for this is the Service monitor for.
A service monitor is a custom resource that we need to create in the same project or namespace where our service is running, aka my-project.
service-monitor.yaml:
apiVersion: monitoring.coreos.com/v1
kind: ServiceMonitor
metadata:
  labels:
    k8s-app: prometheus-app-monitor
  name: prometheus-app-monitor
  namespace: my-project
spec:
  endpoints:
  - interval: 30s
    targetPort: 8080
    path: /q/metrics
    scheme: http
  selector:
    matchLabels:
      app-with-metrics: 'quarkus-app'
And apply it:
oc apply -f service-monitor.yaml
What we have just done is to create a Service Monitor named prometheus-app-monitor that will select apps with the label app-with-metrics: quarkus-app that was added in the previous step when deploying our Quarkus application into OpenShift. Then, OpenShift will call the endpoint /metrics for all the services laballed with app-with-metrics: quarkus-app.
Finally, let’s start using it!
First, we need to call our greetings service: curl http://quarkus-micrometer-my-project.ocp.host/hello.
This will increment our greeting_counter_total counter. But, where can we see the metrics? Let’s browse to OpenShift Console in the Developer > Monitoring view, select Metrics, then Custom Query and type greeting_counter_total, we should see now:
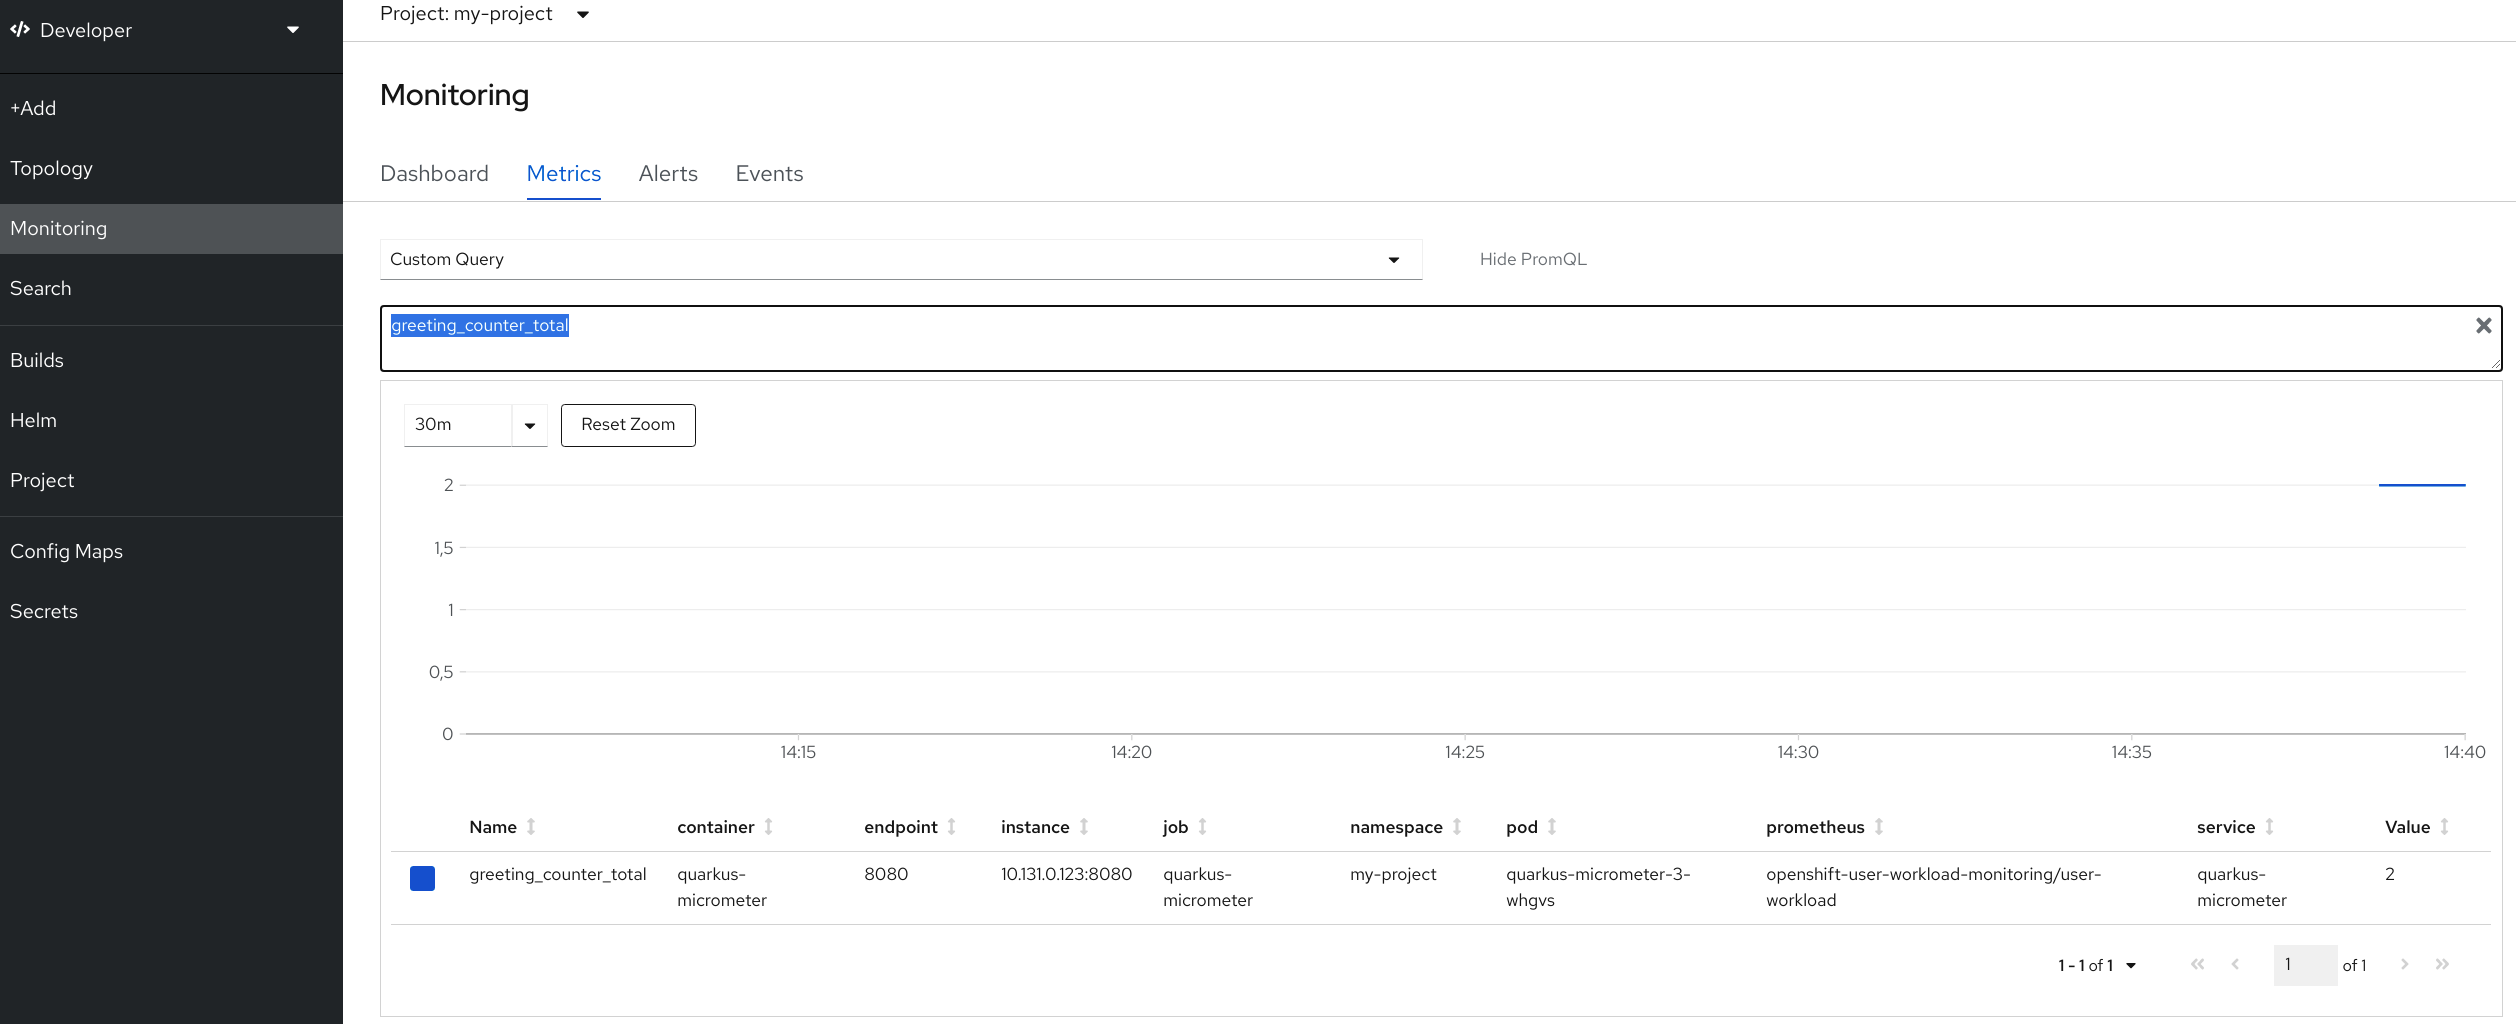
Great! We’re done!
Appendix: Alerts
I left the concept of Alerts out of scope from this post and probably, I will add this content in the future. Alarms is another super useful feature where we can configure custom alarms based on metrics. For example, we can configure OpenShift to display an Alarm when a metric Timer that monitors a service is taking more than 1 min to respond.
We can find more information about this feature in here.
Appendix: Where is Prometheus running?
Remember the namespace you created at step 1.? If we go to this namespace:
oc project openshift-user-workload-monitoring
And get the pods:
oc get pods
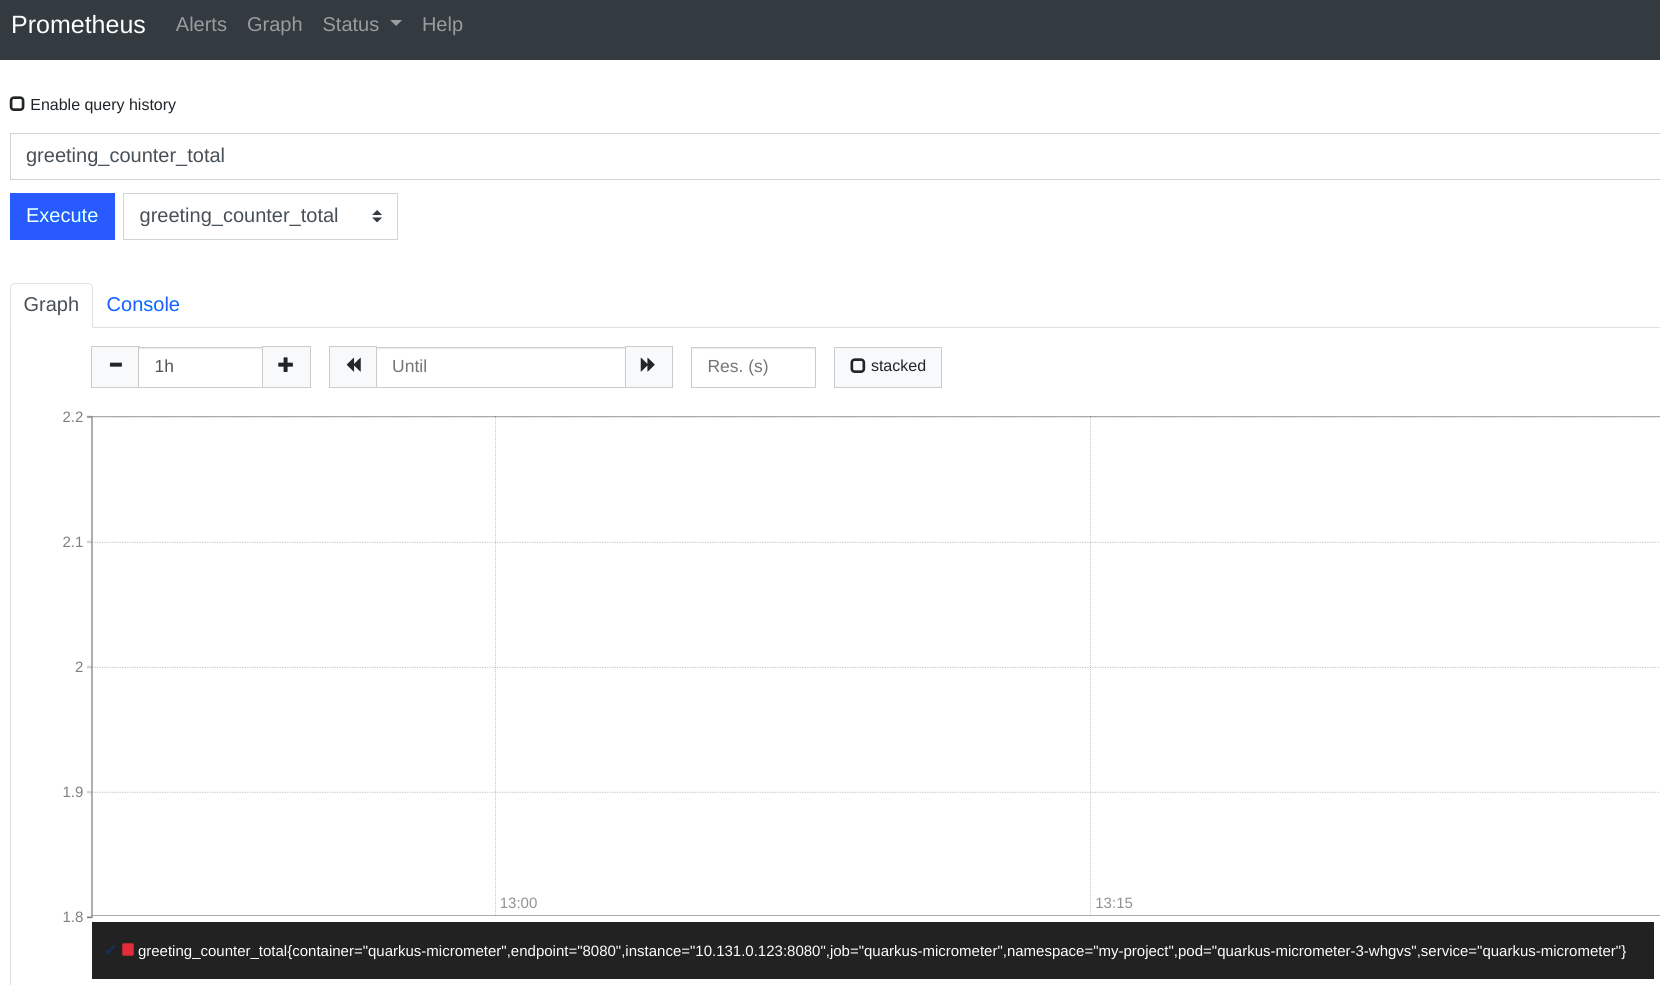
Among others, we should see one pod named with prometheus-user-workload-0, here is where our prometheus instance is running. Indeed, we can directly have access to prometheus by doing a port forward:
oc port-forward prometheus-user-workload-0 9090
And now, we can have direct access to the Prometheus UI:
Appendix: User permissions to create Service Monitors
I struggled a bit when granting the right permissions to users for creating the Service Monitor custom resource. In the end, I had to create this custom role.
monitor-crd-edit-role.yaml:
kind: ClusterRole
apiVersion: rbac.authorization.k8s.io/v1
metadata:
    name: monitor-crd-edit
rules:
- apiGroups: ["monitoring.coreos.com", "apiextensions.k8s.io"]
    resources: ["prometheusrules", "servicemonitors", "podmonitors", "customresourcedefinitions"]
    verbs: ["get", "list", "watch", "create", "update", "patch", "delete"]
Apply it:
oc apply -f monitor-crd-edit-role.yaml
And finally assigned it to our user:
oc adm policy add-cluster-role-to-user monitor-crd-edit <OUR USER>
Conclusion
Source Code: Sgitario/quarkus-examples/quarkus-micrometer