
Visualize structured logs in ELK stack
By default, the logging frameworks outputs the traces in plain text and tools like ELK can’t fully process these traces. We could workaround the issue by adapting the messages using Logstash, but if we are using another tool like Prometheus, we would need to workaround it there as well. Therefore, if we “structure” or send the traces in JSON format directly, all the tools can benefit of.
In this tutorial, we’ll see how to visualize these traces in Kibana (using ELK stack).
Start ELK stack
We’ll be using docker compose to start-up the whole ELK stack.
First, we need to configure our logstash pipeline:
- logstash.conf: let’s listen the file system as input; and send the logs to elasticsearch as only output.
input {
    file {
        path => "/tmp/logs/*.log"
    }
}

output {
    elasticsearch {
        hosts => [ "elasticsearch:9200" ]
        index => "logback"
    }
}
- docker-compose.yml:
version: "3"

services:
  elasticsearch:
    image: docker.elastic.co/elasticsearch/elasticsearch:7.1.1
    environment:
      - discovery.type=single-node
      - xpack.security.enabled=false
    networks:
      - logging-network

  logstash:
    image: docker.elastic.co/logstash/logstash:7.1.1
    depends_on:
      - elasticsearch
    ports:
      - 12201:12201/udp
    volumes:
      - ./logstash.conf:/usr/share/logstash/pipeline/logstash.conf:ro
      - /tmp/logs:/tmp/logs
    networks:
      - logging-network

  kibana:
    image: docker.elastic.co/kibana/kibana:7.1.1
    depends_on:
      - logstash
    ports:
      - 5601:5601
    networks:
      - logging-network

networks:
  logging-network:
    driver: bridge
- Run docker compose:
> docker-compose up
Now, we can browse our traces in our local Kibana.
Start-Up our app
The only thing we would need to do here is to output the traces in the folder that logstash is listening (see above).
logback.xml:
<appender name="FILE" class="ch.qos.logback.core.rolling.RollingFileAppender">
    <file>/tmp/logs/app.log</file>
    <encoder>
        <pattern>%d{dd MMM yyyy HH:mm:ss,SSS} %-5p [%t] %c %logger{36} - %msg%n</pattern>
    </encoder>
    <rollingPolicy class="ch.qos.logback.core.rolling.SizeAndTimeBasedRollingPolicy">
        <fileNamePattern>/tmp/logs/app.%d{yyyy-MM-dd}_%i.log</fileNamePattern>
    </rollingPolicy>
</appender>

<root level="INFO">
    <appender-ref ref="STDOUT" />
    <appender-ref ref="FILE" />
</root>
Configure Kibana to visualize logs
- First, we need to create a new index: follow the instructions here
- And then we can now see our traces in the Discovery page in Kibana! This is how looks like now:
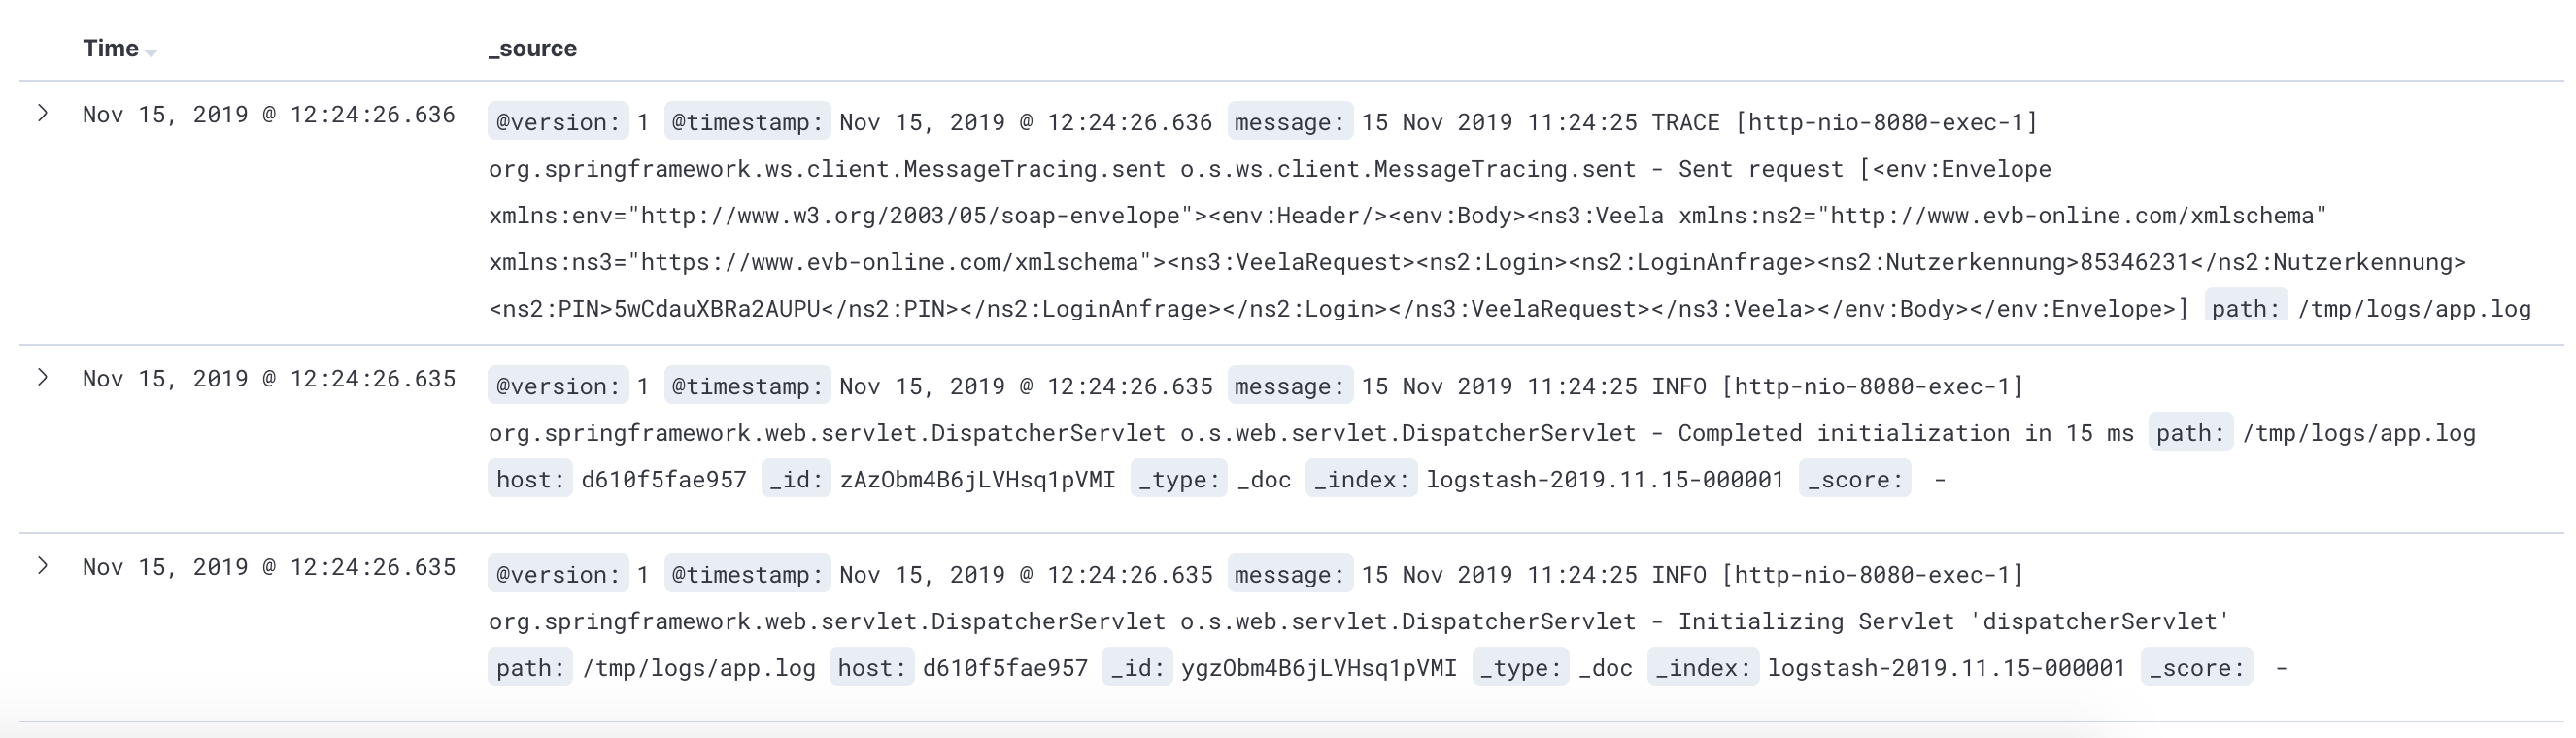
As we can see, the traces are NOT structured. They are still plain messages. Let’s do it!
Structure the traces
With logback and Spring, this is extremely easy:
1.- Add the logstash maven dependency in our pom.xml:
<dependency>
    <groupId>net.logstash.logback</groupId>
    <artifactId>logstash-logback-encoder</artifactId>
    <version>4.11</version>
</dependency>
2.- Configure the appender to use the new logstash encoder:
<appender name="FILE" class="ch.qos.logback.core.rolling.RollingFileAppender">
    <file>/tmp/logs/app.log</file>
    <encoder class="net.logstash.logback.encoder.LogstashEncoder"/> <!-- New encoder! -->
    <rollingPolicy
        class="ch.qos.logback.core.rolling.SizeAndTimeBasedRollingPolicy">
        <fileNamePattern>/tmp/logs/app.%d{yyyy-MM-dd}_%i.log</fileNamePattern>
    </rollingPolicy>
</appender>
Now, we’re sending writting traces in JSON format and logstash is reading these traces from the output file.
Mastering Logs
If we’re building a services app, another really well-designed framework is Logbook by Zalando. This framework will output all the information about requests/responses done within our application. So, every request/response made to our app or done to a third party by our app will be traced. This framework is really well integrated with Spring Boot and HTTP utilities like RestRemplate, HttpClient or OkHttp with minor tweaking.
<dependency>
    <groupId>org.zalando</groupId>
    <artifactId>logbook-spring-boot-starter</artifactId>
    <version>${logbook.version}</version>
</dependency>
So, we’re saying that can trace in and out calls just adding the above dependency in our Spring Boot application, so it would be great if we could correlate all these in/out calls somehow. Let’s embrace Spring Cloud Sleuth that will do exactly this for us. To enable it, it’s just about to add the dependency in the pom.xml as well:
<dependency>
    <groupId>org.springframework.cloud</groupId>
    <artifactId>spring-cloud-starter-sleuth</artifactId>
</dependency>
This dependency will add the “traceId” and “correlation” fields to the trace.
Another nice addition is to structure the Logbook traces a deeper level using Logstash:
logstash.conf:
input {
    ...
}

filter {
    if [logger_name] == "org.zalando.logbook.Logbook" {
        json {
            source => "message"
        }
    }
}

output {
    ...
}
Now, we can see lot of new fields in Kibana like the http.origin, or http.method or http.request. Really useful to troubleshoot issues.
StructuredArguments: Adding new fields when logging traces
The logstash encoder dependency adds a very simple way to add new fields just adding:
import static net.logstash.logback.argument.StructuredArguments.keyValue;

int size = 10;
log.info("Listing messages {}", keyValue("size", size));
However, using this dependency is not the only way to add custom fields, indeed the standard approach is using the MDC (Mappend Diagnostic Context):
MDC.put("size", size);
log.info("Listing messages ");
MDC.remove("size");
try (var ignored = MDC.putCloseable("size", size)) {
  log.info("Listing messages ");
}
Finally, we need to tell the logstash encoder to include the structured arguments in the logback.xml:
<appender name="FILE" class="ch.qos.logback.core.rolling.RollingFileAppender">
    <file>/tmp/logs/app.log</file>
    <encoder class="net.logstash.logback.encoder.LogstashEncoder">
        <provider class="net.logstash.logback.composite.loggingevent.ArgumentsJsonProvider"/><!-- New! -->
    </encoder>
    <rollingPolicy
        class="ch.qos.logback.core.rolling.SizeAndTimeBasedRollingPolicy">
        <fileNamePattern>/tmp/logs/app.%d{yyyy-MM-dd}_%i.log</fileNamePattern>
    </rollingPolicy>
</appender>
And now, we can see the new field available in Kibana:
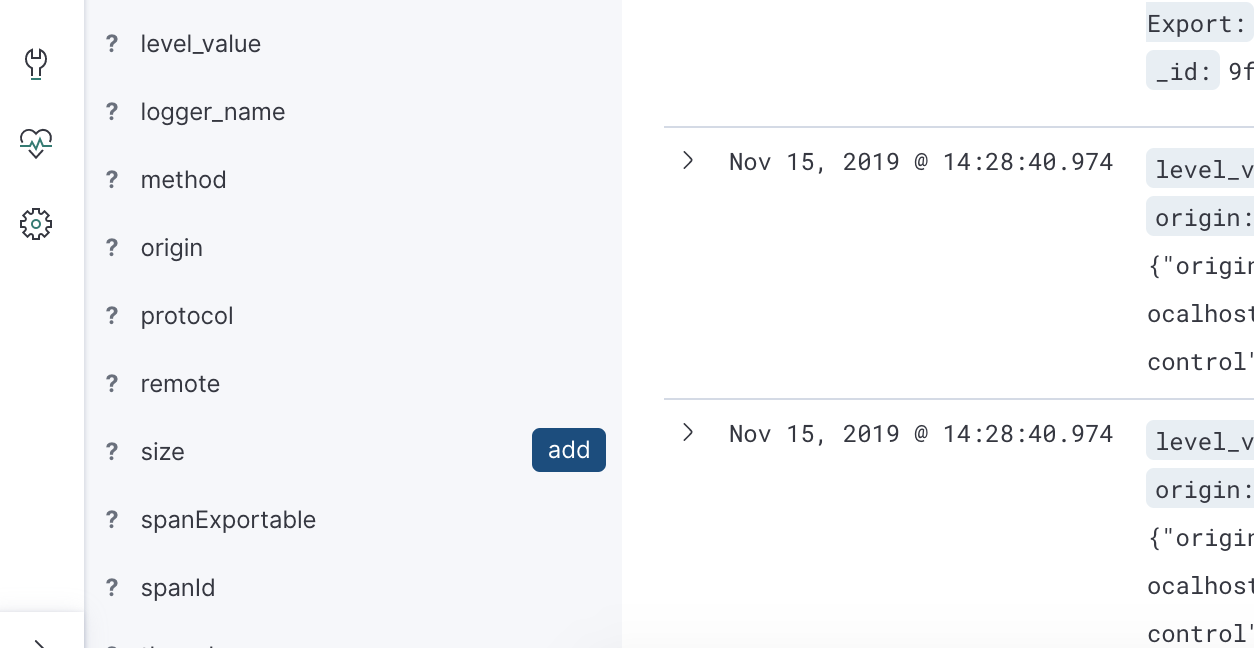
| Update: At latest version of the logstash encoder, you don’t need to provide the provider in order to see the MDC attributes. By default, all the fields will be output. |
Conclusion
In this tutorial, we learnt how to structure and master the traces so they can be easily processed by ELK stack and any other analytic tools. However, JSON has also some limitations like limited length size or typeless, and that’s why GELF cames in to help. I never used GELF before and I think this would be good for a future post rather.
For composing the docker files and configuration, I follow this repository instructions. Also, this [post] was very useful to approach this guide.